
-
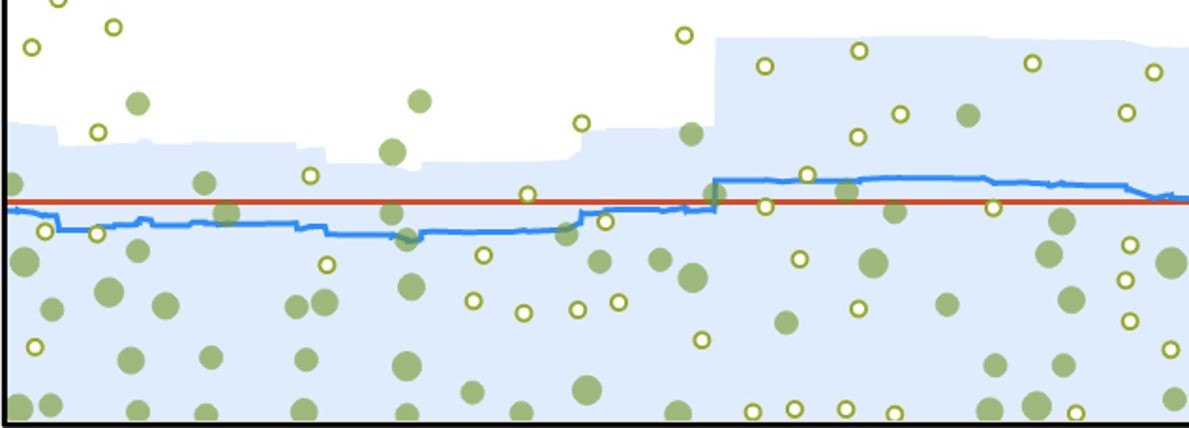
 Cummulative Flow Diagarm
Show the statuses of issues over time.This helps you Ientify potential bottlenecks that need to be investigated.
-
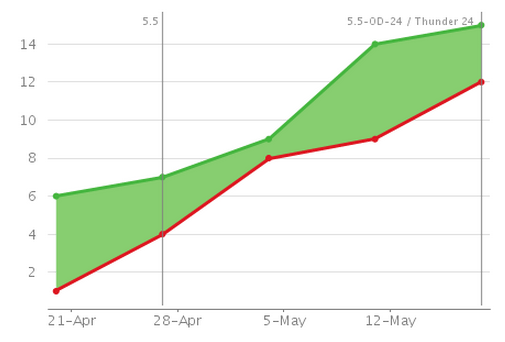
 Control Charts
Shows the cycle time for your product,version or sprint.This helps you identify whether the data from the current process can be used to determine future performance.
ISSUE ANALSYS
-
 Average Age Report
Shows the average age of unresolved issues for a project or filter.This helps you see whether your backlog is being kept up to date.
-
 Created VS Resolved issue
Maps created issues versus resolved issues over a period of time.This can help you understand whether your overall backlog is growing or shrinking.
-
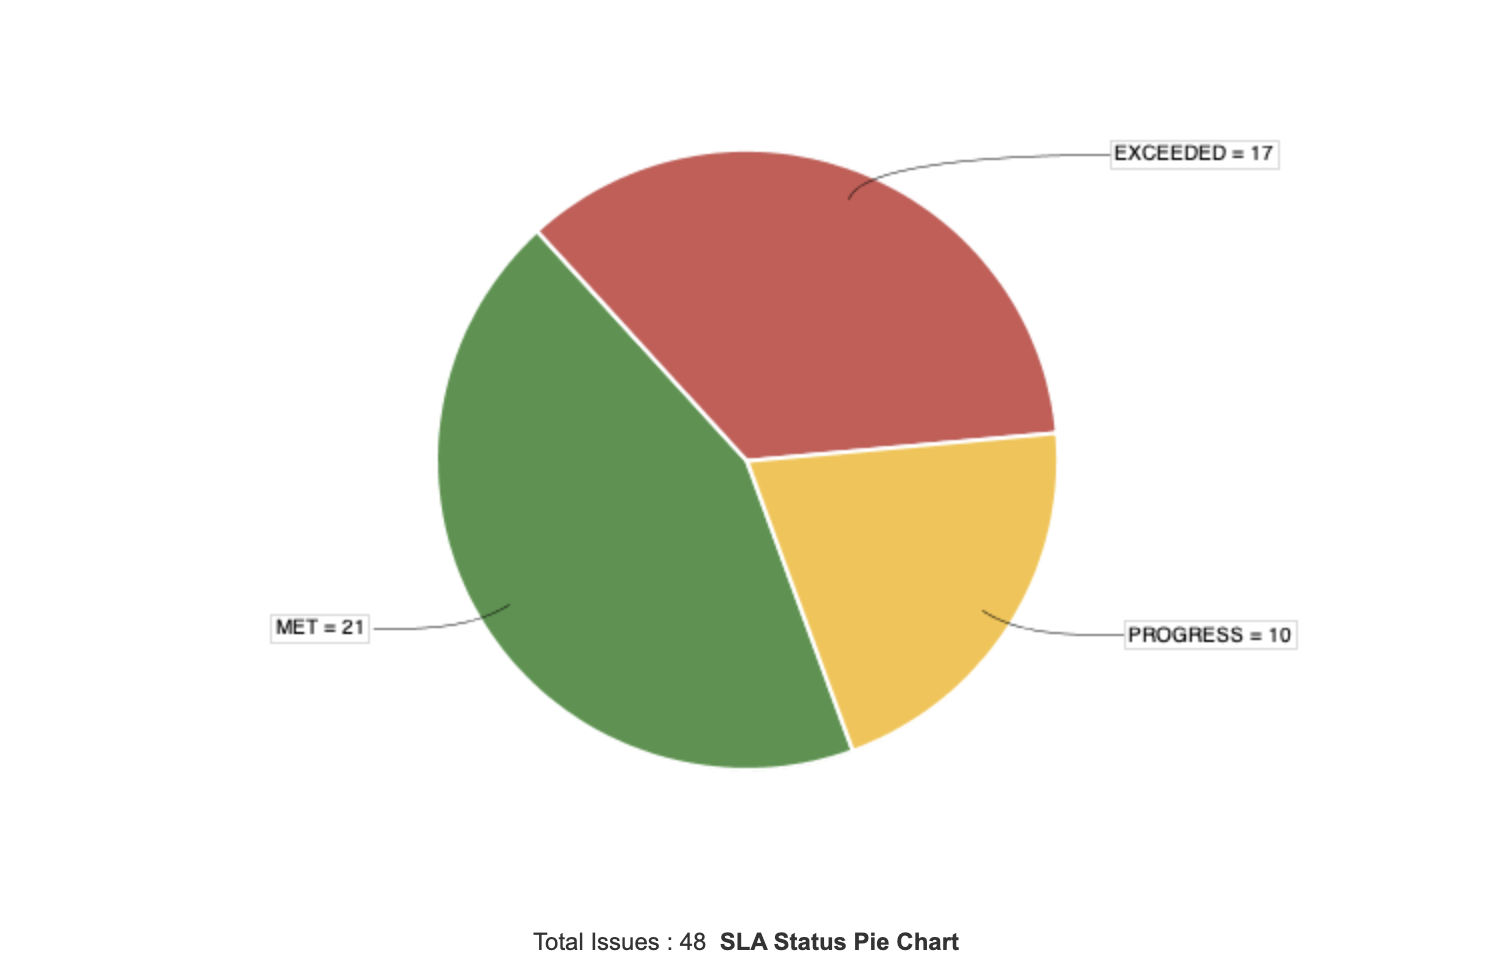 Pie chart
Shows a pie chart of issues for a project/filter grouped by a specified field.This helps you see the breakdown of a set of issues,at a glance.
-
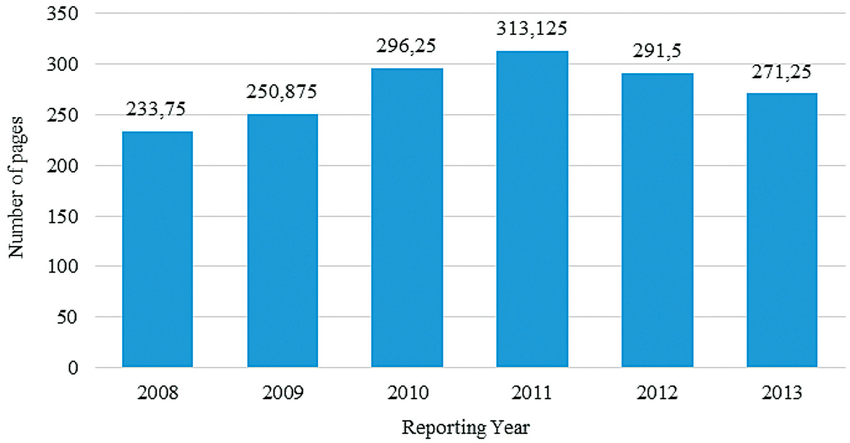
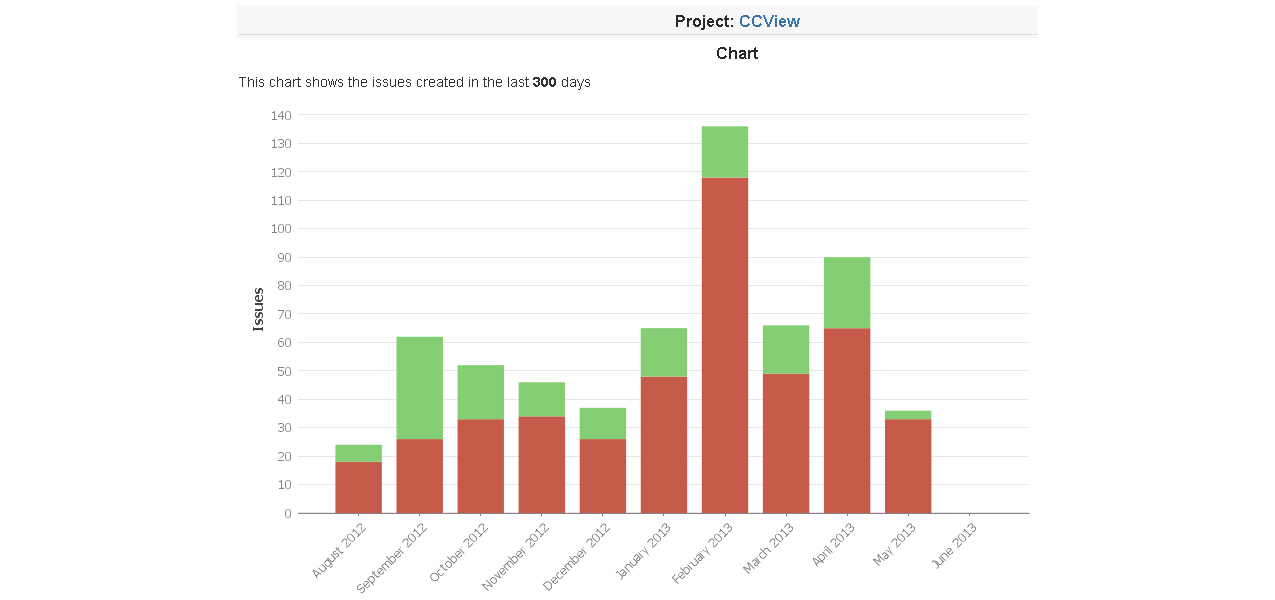 Recently Created Issues Report
Shows the number of issues created over a period of time for a project/filter,and how many were resolved.This helps you understand if your team is keeping up with incoming work.
-
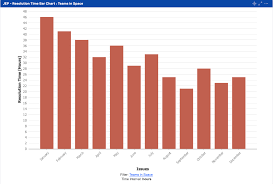
 Resolution Time Report
Shows the length of time taken to resolve a set of issues for a project/filter.This helps you identify trends and incidents that you can investigate further.
-
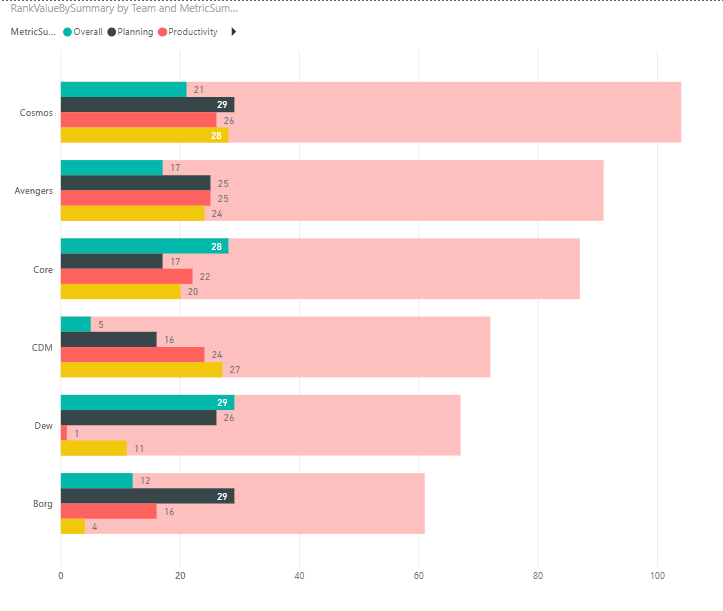 Single Level Group By Report
Shows issues grouped by a particular field for a filter.This helps you group search results by a field and see the overal status of each group.
-
 Time Since Issues Report
For a date field and project/filter,maps the issues against the date that the field was set.This can help you track how many issues were created ,updated,etc, over a period of time.
FORECAST & MANAGEMENT
-
 Time Tracking Report
shows the original and current time estimates for issuesin the current project.This can help you determine whether work is on track for those issues.You can either analyze the report in your browser or use a CSV file.
-
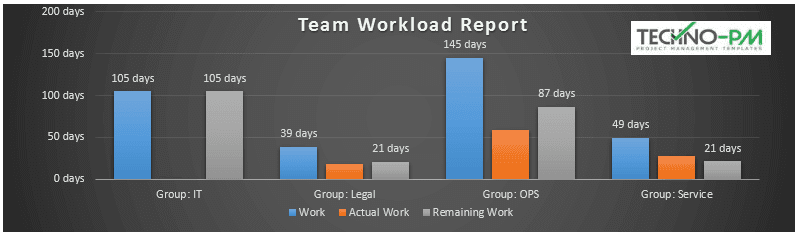 User Workload Report
Shows the time estimate for all unresolved issues assigned to a user across projects.This helps you understand the user's workload better.
-
 Version Workload Report
Shows the time estimates for all unresolved issuesassigned to a version,broken down by user and issues.This helps you understand the remaining work for the version.